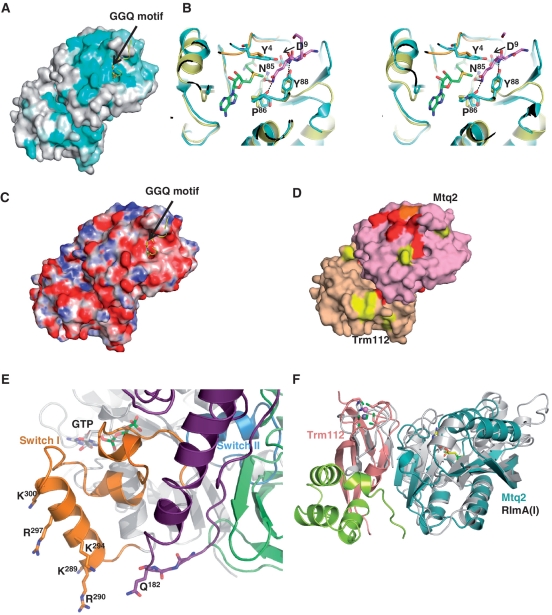
Figure 2.
Mtq2 active site. (A) Mapping of the sequence conservation at the surface of the Mtq2-Trm112 complex. The RF1 peptide containing the GGQ motif (yellow) has been modelled by superimposing the PrmC-RF1 complex onto Mtq2-Trm112 structure. Colouring is from cyan (highly conserved) to grey (low conservation). (B) Stereo view of the comparison of the Mtq2-Trm112 (blue) and PrmC active sites. The RF1 GGQ motif is shown as pink sticks. The PrmC MTase domain and the linker connecting N-terminal to MTase domains are coloured yellow and orange, respectively. The SAM molecule bound to Mtq2 is shown as green sticks. Hydrogen bonds involved in coordination of the RF1 GGQ motif by PrmC are depicted by dashed lines (14). For clarity, only EcMtq2 residue numbers are indicated. (C) Mapping of the electrostatic potential at the surface of the Mtq2-Trm112 complex. Positively (10 kT/e−) and negatively (−10 kT/e−) charged regions are coloured in blue and red, respectively. Neutral regions are in white. The orientation is the same as in panel (A). (D) Mapping of the Mtq2 and Trm112 residues important for eRF1 methylation in yeast. Mutants affecting partially (>50%), moderately (between 10% and 50%) or completely (<10%) eRF1 methylation are coloured in yellow, orange and red, respectively. The Mtq2 and Trm112 proteins are coloured pink and beige, respectively. Same orientation as panel (A). (E) Model of the eRF1-eRF3-GTP complex. The eRF1 GGQ motif is shown in sticks. For clarity, only the central domain from eRF1 is shown (purple). The GTPase, II and III domains from eRF3 are coloured grey, light green and dark green, respectively. The eRF3 switch regions I and II are coloured orange and blue, respectively. The GTP bound to eRF3 is shown as grey sticks. This model has been generated by superimposing the eRF3 GTPase domain and the eRF1 central domain onto the corresponding domains from the recently solved crystal structure of archaeal Pelota/Dom34-aEF1α-GTP complex (6,24,49). As the switch regions from GTPases are known to adopt the same conformation in the GTP form, we have assumed that the switch regions from aEF1α and eRF3 are similar in the GTP form to model the conformation of this region in the eRF3 GTP bound form. Residues are labelled according to S. cerevisiae numbering. (F) Superimposition of E. coli RlmA(I) (grey) onto Mtq2-Trm112 heterodimer (same colour code as Figure 1A). The residues from RlmA(I) and Trm112 involved in zinc coordination are depicted as sticks. The SAM molecule bound to Mtq2 is shown as yellow sticks. The zinc atoms bound to RlmA(I) and Trm112 are depicted as grey and purple spheres, respectively.

