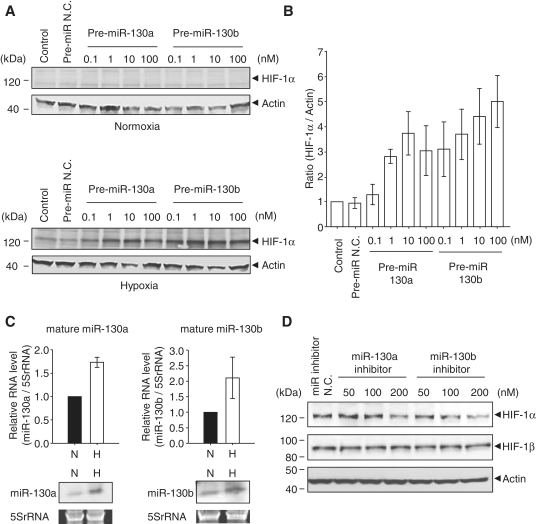
Figure 1.
Effects of the miR-130 family on HIF-1α expression. (A) HEK 293 cells were transfected with 0.1–100 nM of pre-miR-130a and -130b for 48 h, and then cells were exposed to hypoxia for 8 h. Expression levels of HIF-1α and actin were detected by western blot. Pre-miR negative control (pre-miR N.C.) was 100 nM. Left lane (control) shows untransfected cells. (B) HIF-1α expression levels under hypoxia shown in (A) were calculated by the relative expression to actin. The ratio to the control is the mean of four independent experiments ± SD. (C) Endogenous mature miR-130a (top panel, left) and -130b (top panel, right) levels were detected by qRT–PCR. RNA levels for miR-130a and -130b were normalized by 5S rRNA. Solid bars and open bars show normoxia (N) and hypoxia (H), respectively. The ratio to normoxia is the mean of three independent experiments ± SD. Northern blot analyses of mature miR-130a and -130b are shown in the bottom panels. (D) HEK 293 cells were transfected with 50, 100 and 200 nM of miRIDIAN miR-130a and -130b inhibitors for 6 h, and then cells were exposed to hypoxia for 48 h. HIF-1α and HIF-1β expression levels were detected by western blot. A miRIDIAN miR inhibitor N.C.(200 nM) was used as a control.

