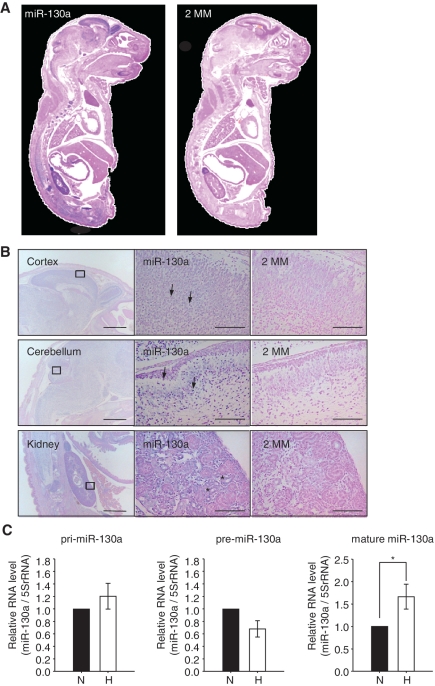
Figure 5.
Tissue distribution of mature miR-130a. (A) In situ hybridization experiment on cryosections of E18.5 mouse embryos. Expression of mature miR-130a was investigated by LNA-modified anti-sense probes that recognize mature miR-130a (left). Right panel shows hybridization using LNA-modified anti-sense probes with 2 nt of the mature miR-130a substituted (2MM). (B) Mature miR-130a was expressed in the cortex (top panel, left), cerebellum (middle panel, left) and kidneys (bottom panel, left). Scale bar = 1 mm. Squares represent areas shown at higher magnifications. Granule cells in the cortex and cerebellum are indicated by arrowheads. Renal tubes in kidney are indicated by asterisks. Scale bar = 100 µm. (C) Hippocampus neuronal cells were cultured under normoxia (solid bars) or hypoxia (open bars) for 72 h. Levels of endogenous pri, pre and mature forms of miR-130a were detected by qRT–PCR. RNA levels were normalized by 5S rRNA. The ratio to normoxia is the mean of five independent experiments ± SD (*P < 0.01).

