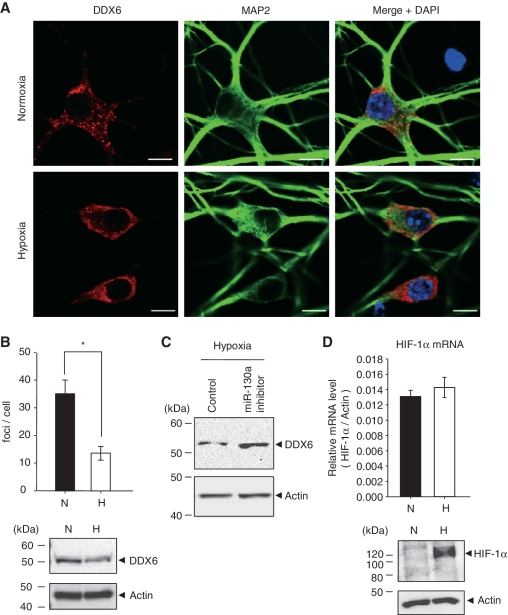
Figure 6.
P-body formation in neurons under hypoxia. (A) After exposure to normoxia (top panel) and hypoxia (bottom panel) for 48 h, cells were stained with DDX6 antibody or MAP2 antibody as a neuronal marker. Nuclei were stained with DAPI. Scale bar = 10 µm. (B) The mean number of P-bodies per cell under normoxia (solid bars) and hypoxia (open bars) are shown. Results represent means ± SE (n = 10, *P < 0.0001). The bottom panel shows endogenous DDX6 expression levels in hippocampus neuronal cells under normoxia (N) and hypoxia (H) for 48 h. (C) Hippocampus neuronal cells were transfected with 50 nM of miRIDIAN miR-130a inhibitor for 48 h, and then cells were exposed to hypoxia for 72 h. DDX6 expression levels were detected by western blotting. Similar results were obtained in two independent experiments. (D) After exposure to normoxia (N, solid bar) and hypoxia (H, open bar) for 48 h, HIF-1α mRNA levels were measured by qRT–PCR. The values were corrected by β-actin mRNA. Results are presented as means ± SD (n = 3). The bottom panel shows endogenous HIF-1α expression levels in hippocampus neuronal cells under normoxia (N) and hypoxia (H) for 48 h.

