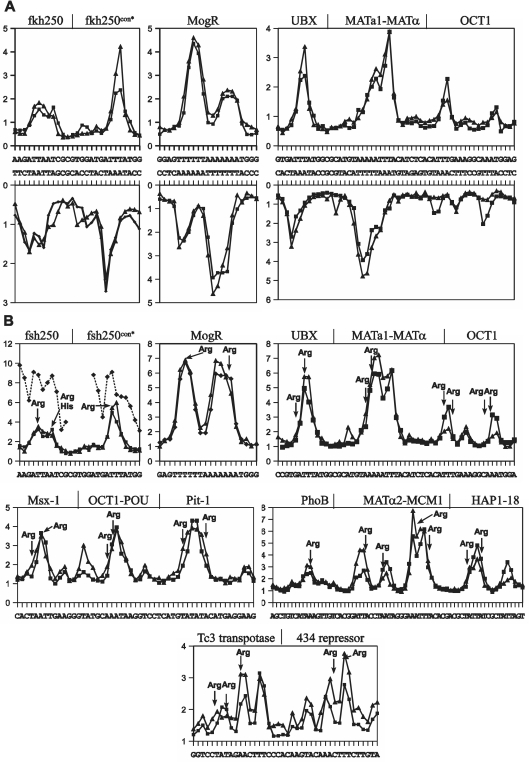
Figure 2.
Experimental and predicted values of uranyl cleavage and minor groove electronegative potential of protein binding sites. (A) Experimental (filled triangle) and predicted (filled square) relative uranyl photo-cleavage (in arbitrary units) at Hox (fkh250 and fkh250con*) (10), MogR (20), UBX-EXD (21), MATa1/Matα2 (22) and Oct1 (23) binding DNA sequences [the difference in intensities between the predicted and experimentally determined values are not meaningful as they depend on the intensities of the bands (exposure) on the gel in the particular analyses]. (B) Predicted and experimental relative electrostatic potential (in arbitrary units) of the six protein binding sites in A and eight additional protein binding sites [Msx-1 (24), Oct-1 POU (25), Pit-1 POU (26), the PhoB response regulator (27), the MATα2/MCM1 complex (28) and the Hap1-18 activator (29), the Tc3 transposase (30) and the phage 434 repressor (31)] based on experimental (filled triangle) and predicted (filled square) uranyl photo-cleavage data. The relative values for electronegative potential determined from the X-ray crystal structure of the Hox-fsh250 complexes (10) are shown as stippled lines (filled diamond). The position of arginine contacts are indicated by arrows.

