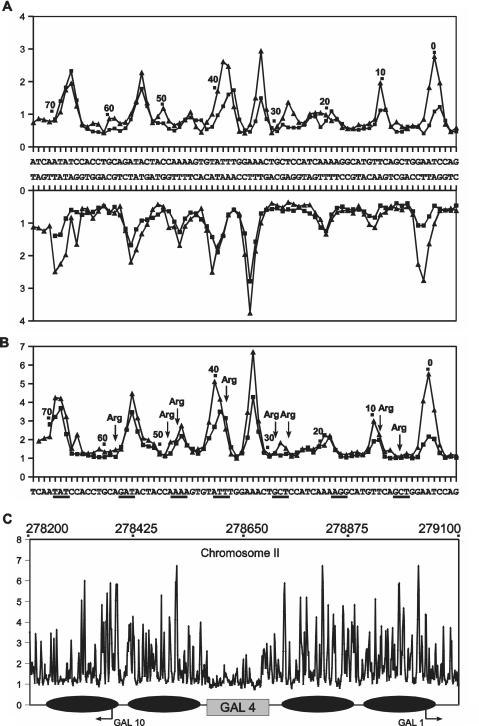
Figure 3.
Uranyl cleavage and minor groove electronegative potential of nucleosome forming sequences. Experimental (filled triangle) and predicted (filled square) uranyl photo-cleavage (A) and relative electrostatic potential map (B) of DNA of a nucleosome core particle (32). One half of the symmetrical DNA in the nucleosome core particle is shown with numbers relative to the center of symmetry. The regions of the highest electronegative potential determined from the X-ray crystal structure (9) are shown as underlined in (B). The positions of arginine contacts are indicated by arrows. (C) Predicted minor groove electronegative potential map in the GAL1-10 locus (positions above the graphs) in chromosome II from Saccaromyces cerevisie. The reported (33,34) in vivo positions of four nuclesomes are shown by ellipses and the region of four GAL four binding sites is indicated by a grey rectangle. The two transcription start sites (GAL 1 and GAL10) in the region are indicated.

