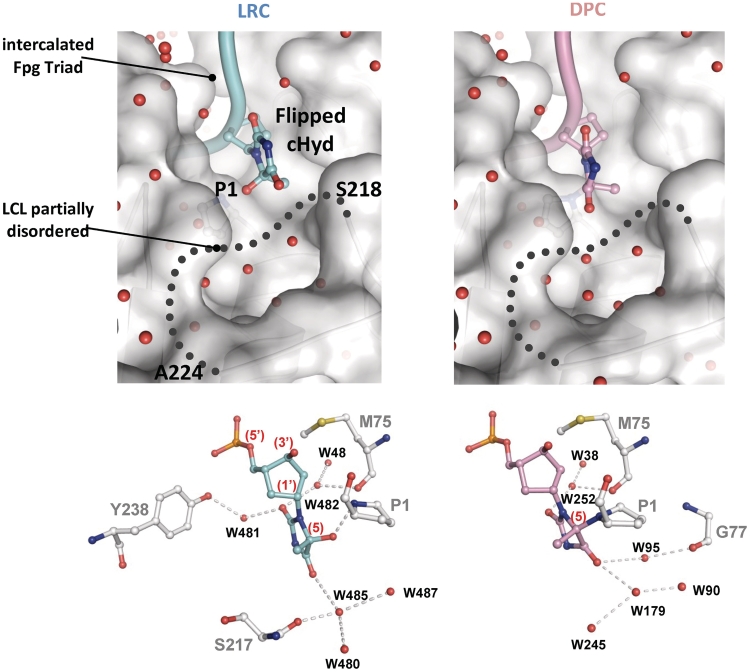
Figure 6.
Protein–DNA contacts inside the base lesion recognition pocket of Fpg. Upper panels show focus views of the extruded damaged nucleoside, free and covalently bound (LRC and DPC, respectively) inside the substrate binding pocket of Fpg. The solvent accessible surface area and the ribbon drawing of the protein are indicated in grey. The side chain of P1 is also indicated. The damaged strand of DNA is represented by a cylinder and the lesion by its ball-and-stick model (in pale blue and pink for LRC and DPC, respectively). The missing part of LCL (residues 218–224) is represented by a gray dotted line. Small red spheres are for structural water molecules. Lower panels show the interaction network (grey dashed lines) between the enzyme and the damaged nucleobase. The Fpg binding residues are in grey and water molecule-mediated interactions are represented by red balls. N, O, S and P atoms are represented by blue, red, yellow, and orange balls, respectively.

