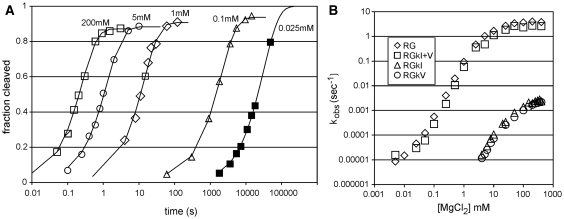
Figure 2.
Self-cleavage of the RG ribozyme and mutants with a disrupted or restored kissing interaction. (A) Example time courses of RG self-cleavage at the indicated concentrations of MgCl2. To display the wide range of observed cleavage rates, the time coordinate (X-axis) is plotted using a log10 scale. (B) Apparent first-order cleavage rate constants (kobs) for RNAs with an intact (RG, RGkI+V) or disrupted (RGkI, RGkV) kissing interaction. Data are the means of two to five replicates; SDs (data not shown for clarity) were typically less than the size of the symbols used to plot the means.

