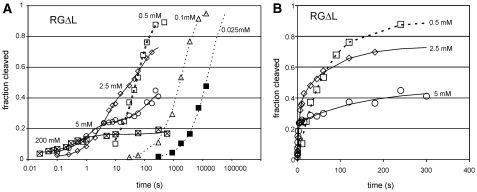
Figure 3.
Self-cleavage of the RGΔL ribozyme. (A) Example time courses of RG self-cleavage at the indicated concentrations of MgCl2; plotted as in Figure 2. (B) Conventional plot of fraction cleaved versus time showing biphasic cleavage at higher MgCl2 concentrations.

