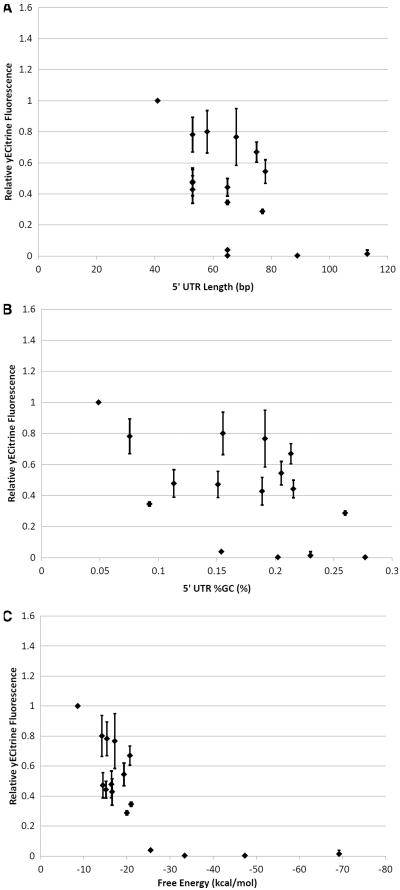
Figure 3.
Prospective correlates of expression in the TEFpmut5 insert series. yECitrine expression levels were measured in each of the TEFpmut5 constructs listed in Supplementary Table S1 and plotted against (A) 5′-UTR length, (B) GC content and (C) folding energy. Each plot has been scaled relative to the fluorescence of pT5Y. Error bars represent the standard deviation in fluorescence observed across biological triplicates. Fluorescence is seen to monotonically vary with free energy level, thus suggesting 5′-UTR secondary structure as the leading cause of this phenomenon.

