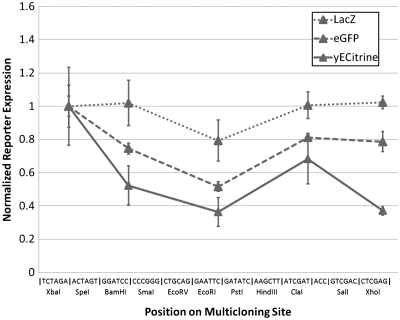
Figure 4.
Effect of gene length and codon usage on translational inhibition. LacZ and eGFP expression levels were measured in each of the constructs listed in Supplementary Tables S5 and S6, respectively, and compared with data for yECitrine. Each series has been normalized to unity at the first restriction site. Position on the MCS has been measured according to the unique restriction sites in the p416 vector. Error bars represent the standard deviation in reporter output observed across three biological replicates. The impact of 5′-UTR inhibition is most pronounced in short, codon optimized genes.

