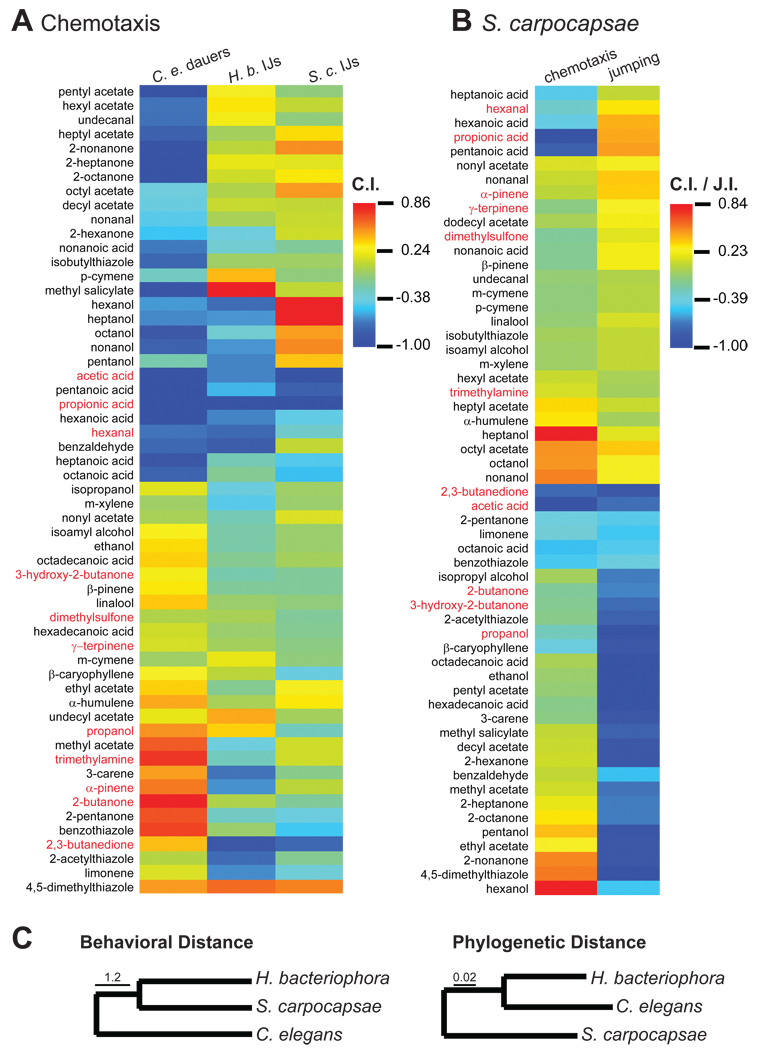
Figure 4. Odor response profiles of free-living and parasitic nematodes.
A. Odor response profiles of C. elegans dauers, H. bacteriophora IJs, and S. carpocapsae IJs. n = 5–33 trials for each odorant. B. A comparison of odorant-evoked chemotaxis and jumping by S. carpocapsae. Both the chemotaxis index (C.I.) and the jumping index (J.I.) range from −1 to +1, with −1 indicating perfect repulsion and +1 indicating perfect attraction (Figures S2B and S4A). n = 5–8 trials for chemotaxis and 3–10 trials for jumping. Data for chemotaxis is from A. For A and B, response magnitudes are color-coded according to the scale shown to the right of each heat map, and odorants are ordered based on hierarchical cluster analysis. Host odorants identified by TD-GC-MS of insect headspace are highlighted in red. C. The odor response profiles of H. bacteriophora and S. carpocapsae are more similar to each other than to that of C. elegans, despite the fact that H. bacteriophora and C. elegans are more closely related phylogenetically. Left, behavioral dendrogram of olfactory responses across species. Behavioral distance is based on the Euclidian distances between species based on their odor response profiles. Right, phylogenetic neighbor-joining tree. Branch lengths in the phylogenetic tree are proportional to genetic distances between taxa; scale bar represents 0.02 nucleotide substitutions per site. See also Figure S4 and Table 1.

