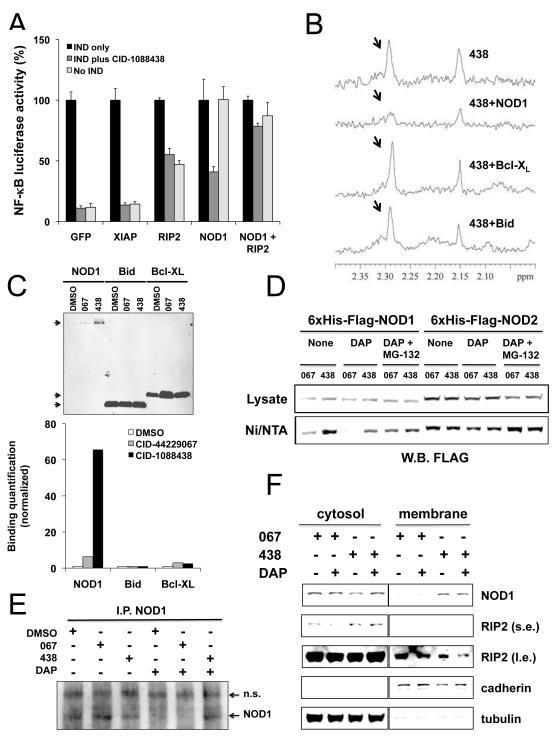
Figure 3. Analysis of mechanisms of chemical inhibitors of NOD1.
(A) HEK 293T-NF-κB-luciferase cells were transfected with plasmids encoding NOD1, RIP2, XIAP, or GFP in various combinations. After 24hr, cells were cultured with or without 3.5 μg/ml γ-tri-DAP, 10 μM of CID-1088438, or combinations of these reagents for 24 hrs before measuring luciferase activity normalizing data to GFP-transfected cells (100%) (mean ± SD, n=4). (B) 1D 1H-NMR spectra were collected for CID-1088438 (50 μM) in the absence (upper spectrum) and presence (lower spectra) of 5 μM of His6-Flag-NOD1, His6-Bcl-XL, or His6-Bid purified proteins, respectively. CID-1088438-derived proton signal intensity (arrows) is only suppressed in the presence of NOD1, thereby demonstrating direct interaction between ligand and protein. (C) Purified His6-Flag-NOD1, His6-Bcl-XL, or His6-Bid proteins (≈0.4 ug) were pre-incubated for 60 minutes with 20 μM CID-1088438 or CID-44229067 (DMSO as control). Ni-NTA agarose beads were then added and the mixture was incubated overnight at 4°C. Ni/NTA pull-down was performed and samples were analyzed by immunoblotting using anti-His antibody (top). Quantification of proteins on blots was performed, normalizing data relative to DMSO control (bottom). (D) MCF-7 cells stably expressing His6-FLAG-NOD1 or His6-FLAG-NOD2 were cultured with 5 μM of CID-1088438 or CID-44229067 and 10 μg/ml γ-tri-DAP alone or with 1 μM MG-132. After 16hr, cells were lysed and equal amounts of protein samples were pulled down using Ni/NTA resin beads. Total protein lysates (30 μg) and Ni/NTA-bound proteins were analyzed by immunoblotting using anti-FLAG antibody. (E) HCT-116 cells were treated with DMSO (control) or with 10 μg/ml γ-tri-DAP, with or without 5 μM of CID-1088438 or CID-44229067. After 24 hr in rabbit anti-NOD1 antibody immunoprecipitates were prepared and analyzed by immunoblotting using rat anti-NOD1 antibody. Non-specific (n.s.) and NOD1-specific bands are indicated. (F) MCF-7 cells stably expressing His6-FLAG-NOD1 were cultured with 5 μM of CID-1088438 or CID-44229067 alone or combined with 5 μg/ml γ-tri-DAP. After 24hr, cytosolic and membrane subcellular fractions were isolated and analyzed (10 μg protein) by immunoblotting using antibodies specific for α-tubulin (cytosolic marker), pan-cadherin (plasma membrane marker), NOD1 (using anti-FLAG antibodies) and RIP2. Short (s.e.) versus long (l.e.) exposures of blots are presented for some results. All data are derived for a single blot. Intervening lanes were graphically excised (vertical line) for efficiency of presentation. See also Figures S1-S3 and S8-S12.

