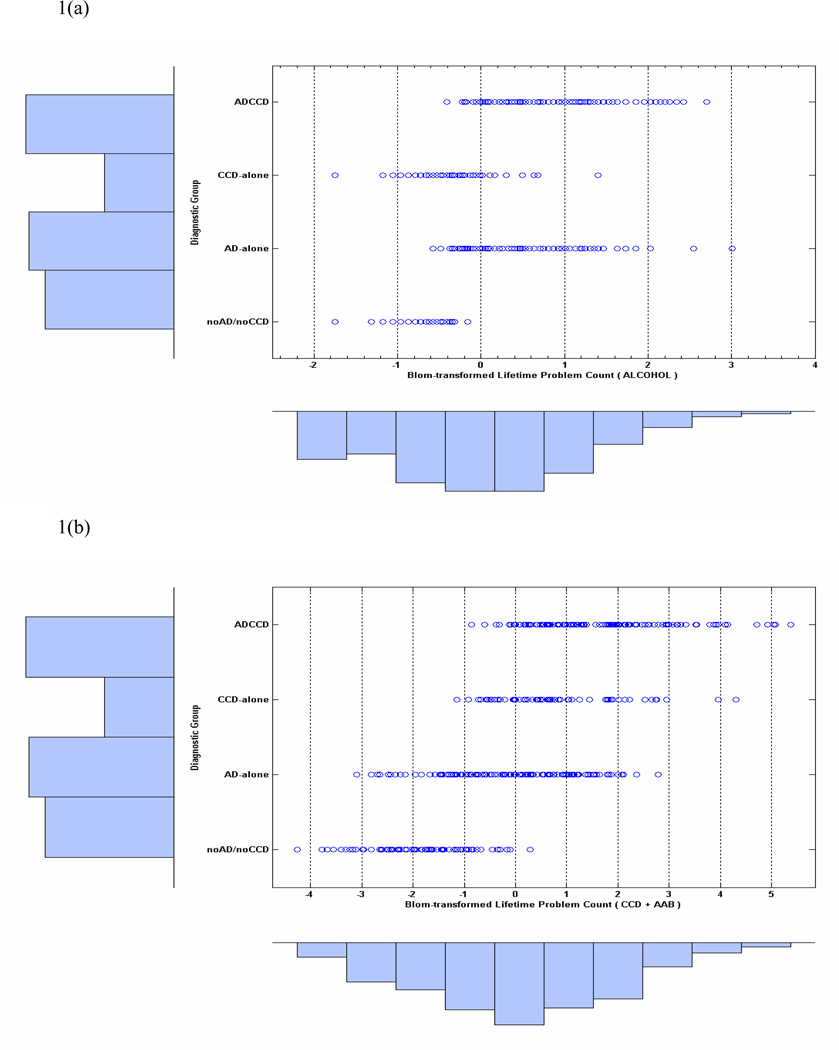
Figure 1.
(a). Dot-plots of the distribution of Blom-transformed alcohol lifetime problem counts by group. The marginal distribution of problem counts combined across all groups is represented by the frequency histogram below the abscissa. Sample sizes are shown by the histogram displayed on the left ordinate. Figure 1(b). Distribution of Blom-transformed total lifetime antisocial problems (CCD + AAB) for each group.

