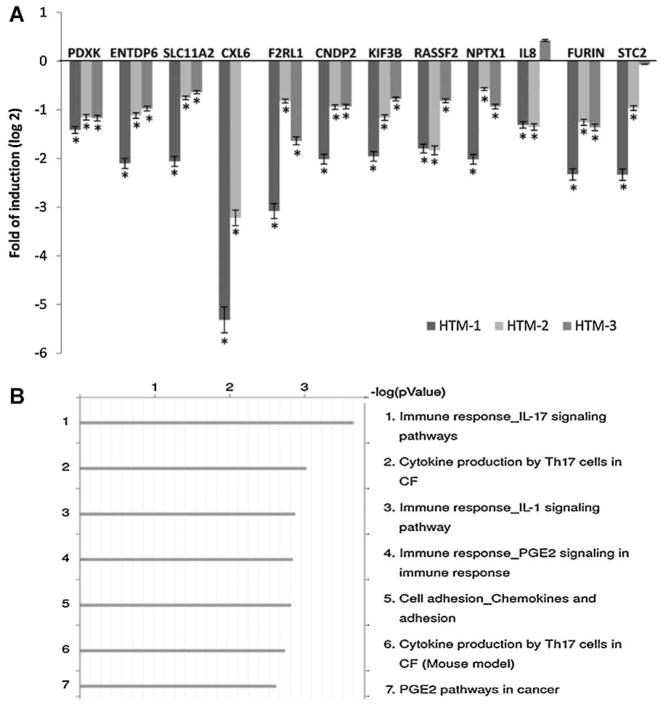
Fig. 2.
Validation of Affymetrix microarray data and analysis of canonical pathways affected by miR-24. Panel A represents the logarithm of the fold change on gene expression of HTM cells transfected with miR-24 mimic compared to cells transfected with scramble control in three primary cell lines. The expression of 12 genes significantly down-regulated on the array (Gene symbol: PDXK, ENTDP6, SLC11A2, CXXL6, F2RL1, CNDP2, KIF3B, RASF2, NPTX1, IL8, FURIN, and STC2) were analyzed by Q-PCR. Bars represent standard deviation from three different experiments; one asteriskmeans P ≤ 0.05. Panel B represents the seven canonical pathways most significantly affected by miR-24 mimic compared to controls and was generated using Metacore pathway analysis and the genes significantly up- or down-regulated by more than 1.5-fold (P ≤ 0.05) on the Affymetrix U133A2 arrays (CF = cystic fibrosis).

