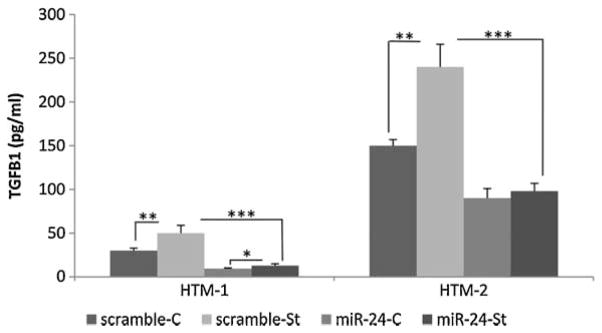
Fig. 5.
Increase in active TGFβ1 induced by CMS was prevented by miR-24. Figure represents the amount of TGFβ1 (pg/ml) in two HTM cell lines transfected with miR-24 or scramble control and subjected to CMS for 16 h (St) or no mechanical force was applied in the control (C). Bars represent standard deviation from three different experiments. One, two, and three asterisks means P ≤ 0.05, 0.01, and 0.001.

