
Fig. 6.
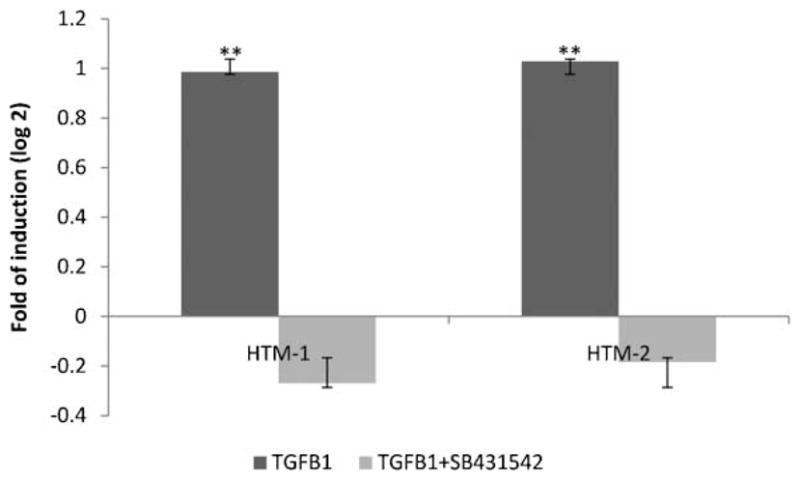
TGFβ1 increased expression of miR-24. Figure represents the logarithm of the fold change of miR-24 after 24 h of treatment with TGFβ1 (1 ng/ml) or TGFβ1 plus SB431542 (10 μM), a TGFβ1 inhibitor. Bars represent standard deviation from three different experiments in two HTM cell lines; two asterisks means P ≤ 0.01.