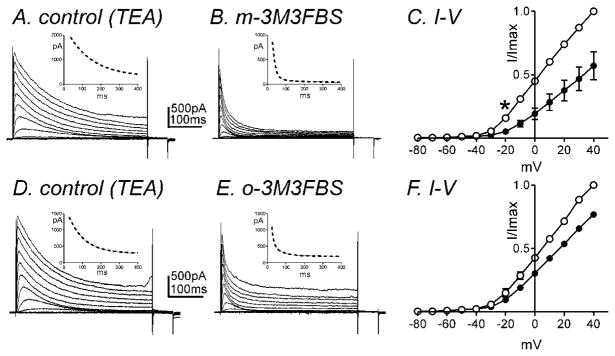
Fig. 3.
IA is inhibited by m-3M3FBS. Membrane potential was stepped from −80 to +40mV in 10mV increments from a holding potential of −80mV (A) in the presence of TEA (10mM, control) and (B) in the presence of m-3M3FBS (10μM) in TEA. (C) Normalized I-V relationships in control (○) and m-3M3FBS (●). Peak currents (I) were normalized with the peak current at +40mV (Imax). m-3M3FBS (10μM) significantly decreased IA (n=4, * denotes P<0.05 at −20mV). All tested potentials positive to −20mV were significant. (D–F) o-3M3FBS also significantly decreased IA (n=4). Insets illustrate the time constant of inactivation with single exponential fit (panel A & C, dotted line) and double exponential fit (panel B & E, dotted line) at +20 mV.

