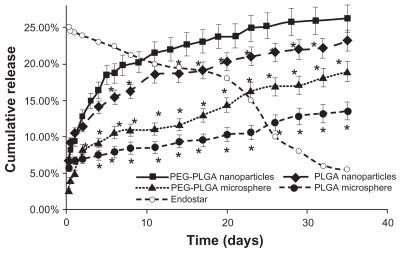
Figure 1.
Release profiles of endostar from PLGA nanoparticles, PEG-PLGA nanoparticles, and PLGA and PEG-PLGA microspheres in phosphate-buffered saline. The error bars represent means ± standard deviation. The dissolution of endostar with a 25% concentration is also described.
Note: *Significantly different from PEG-PLGA nanoparticles (P < 0.05).

