Figure 4.

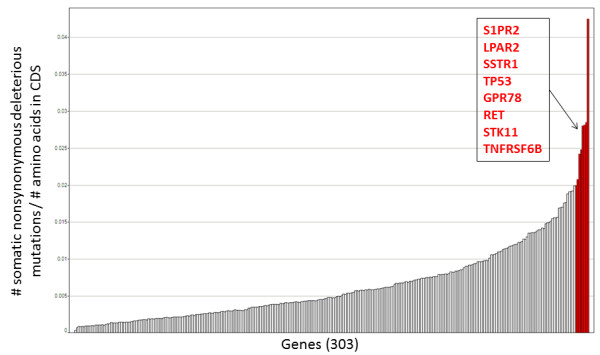
Bar chart of rate of deleterious mutations across gene sequenced. Genes sequenced are shown on the x-axis. The number of deleterious somatic nonsynonymous mutations observed in each gene/number of amino acids in each CDS in plotted.

Bar chart of rate of deleterious mutations across gene sequenced. Genes sequenced are shown on the x-axis. The number of deleterious somatic nonsynonymous mutations observed in each gene/number of amino acids in each CDS in plotted.