Figure 6.

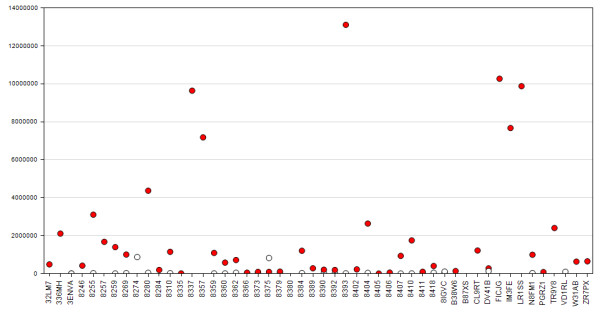
Expression of KLK6 across study samples confirmed by q-PCR. Red dots denote cancer samples and white dots denote normal samples. Patient IDs are arranged on the x-axis. The y-axis is the mRNA abundance.

Expression of KLK6 across study samples confirmed by q-PCR. Red dots denote cancer samples and white dots denote normal samples. Patient IDs are arranged on the x-axis. The y-axis is the mRNA abundance.