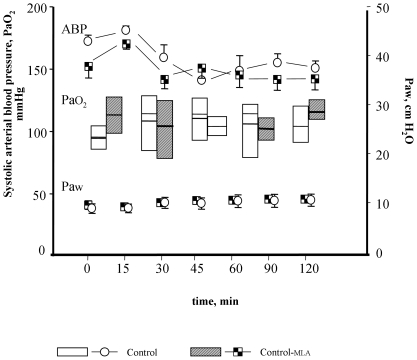
Figure 1. Time course of arterial oxygen partial pressure (PaO2), airway pressure (Paw), and systolic arterial blood pressure (ABP) in rats ventilated with conventional ventilation and pre-treated with saline (Control) or methyllycaconitine (Control-MLA).
Data are presented as mean + SEM for ABP (lines and plots) and Paw (plots). PaO2 is presented as box plots: the box represents the 25 and 75 percentiles, mean and median are presented as horizontal lines. No significant change was measurable.

