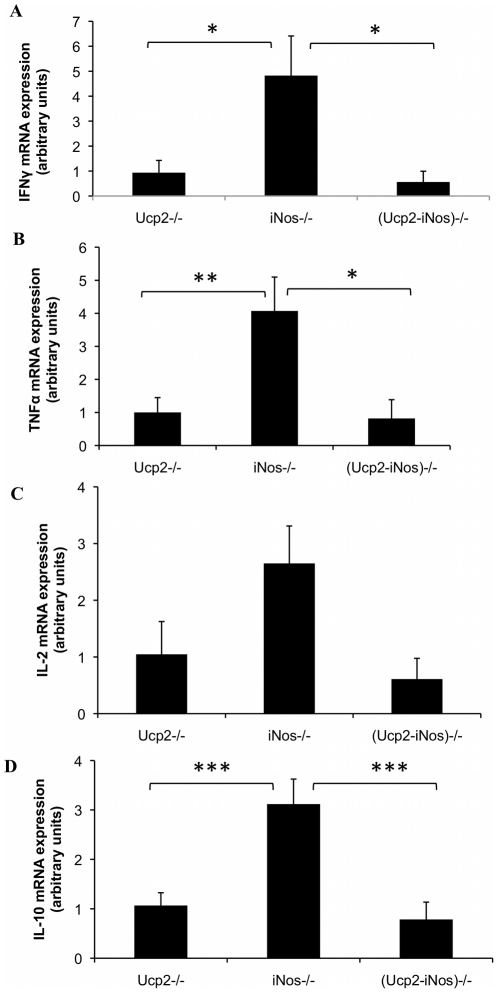
Figure 3. Relative expression of cytokines mRNA in CNS homogenates.
Fourteen days after EAE induction, brains and spinal cords were collected and levels of mRNAs were assessed by real time quantitative PCR as described in Materials and Methods. Data represent mean ± SEM of 7–12 mice per strain. *, P<0.05; **, P<0.01; ***, P<0.001.

