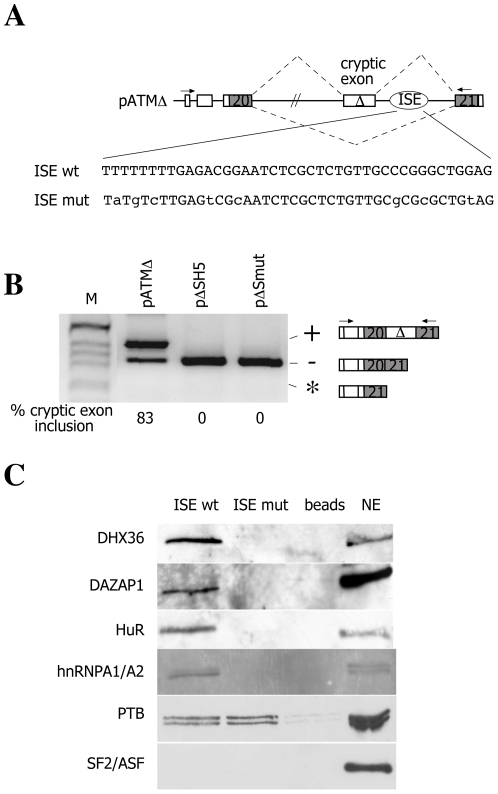
Figure 1. Analysis of the ISE binding capacity.
A) Schematic representation of the pATM minigene. α-globin and ATM exons are white and grey boxes, respectively, and introns are lines. The cryptic 65 bp ATM exon activated by the GTAA deletion (Δ) is indicated and the oval show the position of the ISE. Splicing pattern is represented with diagonal dashed lines and the arrows indicate location of the primers used in RT-PCR analysis. The nucleotide sequence of normal and mutant ISE is shown. B) Splicing assay. The pΔ minigenes were transfected in HeLa cells and the pattern of splicing analyzed with E16 and 2550 primers. In pΔSH5 the ISE has been deleted. RT-PCR fragments were resolved on 2% agarose gel. M is the molecular weight marker. The cryptic exon inclusion and exclusion are indicated. The asterisk corresponds to a minor spliced product without the hybrid exon made of globin exon 3 and ATM exon 20. The % of cryptic exon inclusion is indicated and is the mean of three independent experiments. C) Western blot analysis of pull down assay performed on ISE wt and ISE mut sequences. The binding analysis of RNA helicase DHX36, DAZAP1, HuR, hnRNPA1, PTB and SF2/ASF protein. Upon in vitro transcription, RNAs were covalently bound to the agarose beads and incubated with HeLa nuclear extract. After washing steps, the pulled down proteins were loaded on SDS-PAGE gel and analyzed by western blotting using antibodies against RNA helicase DHX36, DAZAP1, HuR, hnRNPA1, PTB and SF2/ASF proteins. The nuclear extract (NE) corresponds to the 1/20 of the amount used in pull down assay. ISE wt sequence pulled down RNA helicase DHX36, DAZAP1, HuR, hnRNPA and PTB whereas the ISE mut fraction was enriched only in PTB. SF2/ASF was not detected in either of fractions.

