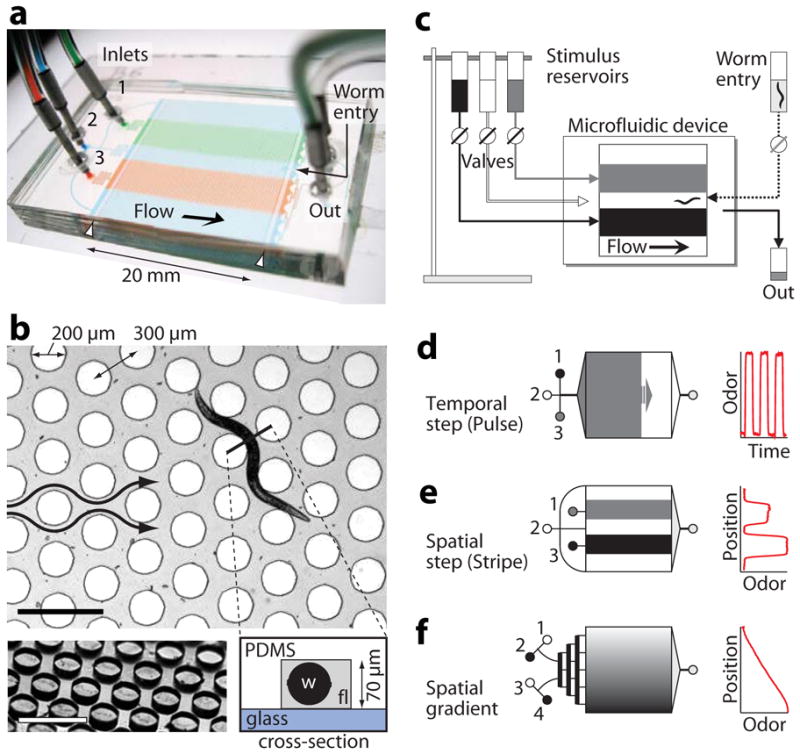
Figure 1.

Worm behavioral arena and stimulus patterns. (a) Photo of the microfluidic device, configured such that continuous flow of three streams (1–3) produces a stable pattern of dye stripes within the arena. Worm barriers prevent passage out of the arena (white arrowheads). (b) Top view showing arena geometry. A young adult worm crawls through fluid-filled channels (gray) between cylindrical microposts (white circles). Arrows indicate the direction of flow. Bottom left shows an oblique view of the micropost array before device assembly. Bottom right schematic shows a cross-section, indicating the glass bottom surface, PDMS top surface and posts, worm (w) and stimulus fluid (fl). Scale bars, 500 μm. (c) Stimuli flow by gravity from elevated reservoirs through external valves into the device. Worms are loaded with a syringe. (d–f) Upstream channels are tailored to each stimulus pattern: inlet channels converge to a distribution tree for stimulus pulses (d), remain separated for stimulus stripes (e), or pass though a mixing tree to create linear or sigmoidal concentration profiles (f). The graphs on the right show the corresponding odor patterns, estimated by measured dye concentration with respect to time or position in the device.
