Figure 2.
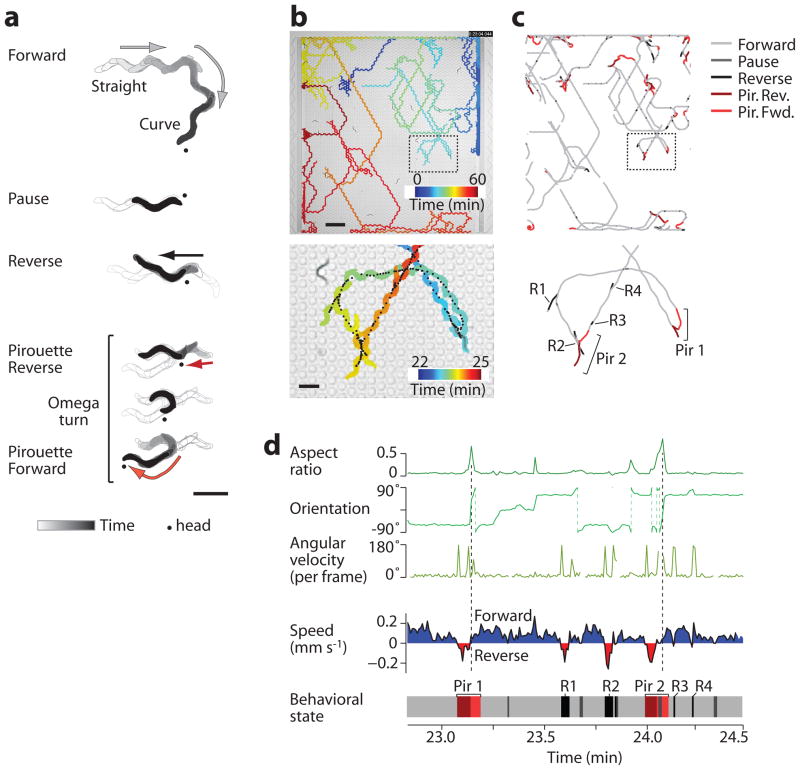
Locomotory behavior in structured arenas. (a) Representative tracks from a single worm demonstrating the indicated behavioral states. Dot indicates the head of the worm. Arrows and shading show the direction of travel. (b) The path taken by one representative wild-type worm (of 24) over 1 hr shows navigation across the entire buffer-filled arena (above) and a magnified region (below). Color indicates time in the device. Black points indicate the animal centroid at 0.5 s intervals. (c) The centroid path for the animal in b, colored according to behavioral state. Swimming behavior at the upstream and downstream barriers was removed from analysis, and path breaks indicate temporary collisions with other animals. Specific reversal (R) and pirouette (Pir) behaviors are labeled in the magnified view below. (d) The graphs show the timecourse of morphological parameters (green plots, above) and speed (shaded plot, below) for the magnified worm path in c. The corresponding behavioral state (bottom plot, colored as in c) was automatically determined from these parameters for each video frame (Supplementary Notes); for example, reversals are bounded by high angular velocity, and omega turns are identified by high aspect ratio and sharp reorientation (dashed lines). Labeled events correspond to the behavior trace in c. Scale bars, 500 μm (a and b, lower panel) and 2 mm (b, upper panel).

