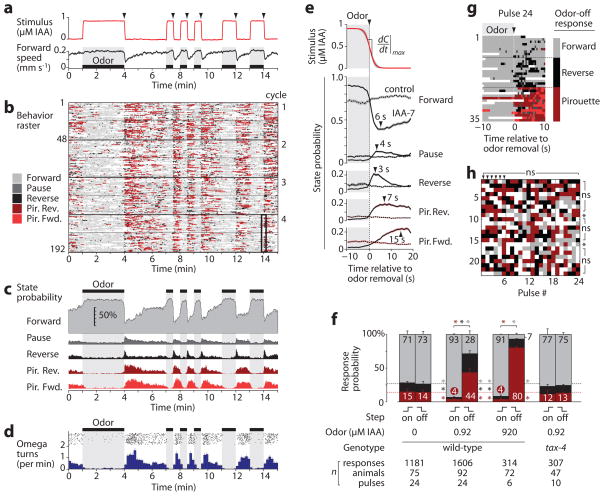
Figure 3.
Odor pulse assay. (a) Odor concentration estimated from dye absorbance during one cycle of IAA pulses (top), and corresponding instantaneous forward locomotion speed (bottom, n = 48 worms) are shown. (b) Ethogram showing the instantaneous behavioral state of animals subjected to the odor pattern in a. Each row represents one animal, and four 15-min cycles are shown stacked for a total of 192 rows. Speed traces and ethograms for each animal were aligned in time to the odor step it experienced. (c) Instantaneous behavioral state probability from b, excluding collisions and animals near the barriers. (d) Initiation of individual omega turns from b (black points, top) and average omega turn rate per animal (below, mean ± s.d.). (e) Average stimulus (top graph) and behavioral dynamics (lower graphs) for repeated odor removals (shading indicates 95% confidence for odor and s.e.m. for state probability, n = 24 pulses). Peak response times (arrows) are indicated. The dotted lines show buffer-buffer control switches. (f) Average probability of response to odor addition and removal (mean ± s.e.m., n = 6–24 pulses). Numbers indicate percent probability. *, P < 0.01 vs. wild-type odor-free probability of forward (gray), reverse (black), or pirouette (red) responses. (g) Ethogram showing a ±10 s window around odor removal #24 (black box in b), sorted by the predominant behavioral state after odor removal. (h) Responses of 23 individual animals to 24 repeated odor removal steps, colored as in g. *, P < 0.05; ns, not significant vs. the population mean by the mass function of the trinomial distribution and the Benjamini–Hochberg–Yekutieli correction for false discovery rate.

