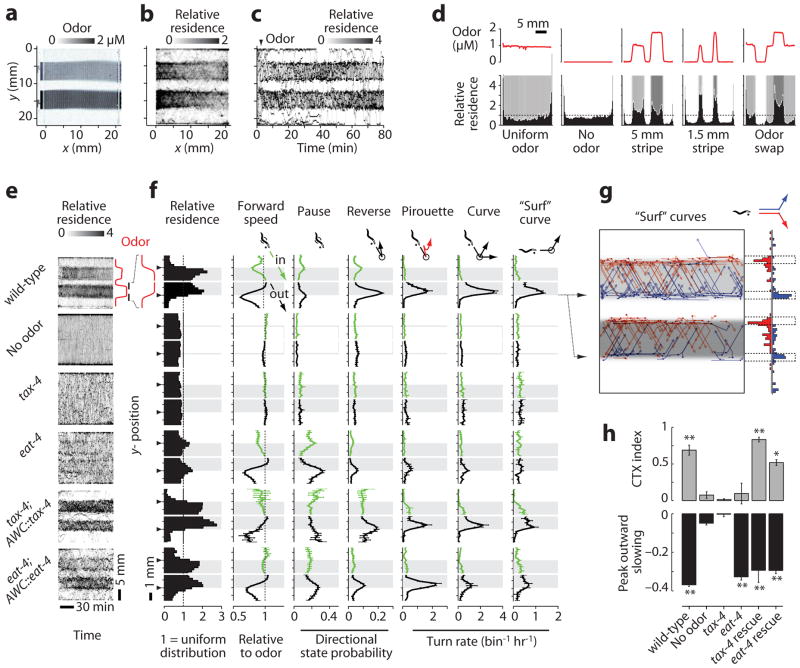
Figure 4.
Odor stripe assay. (a) The image shows the arena with two odor stripes containing 0.92 or 1.84 μM IAA and dye, surrounded by buffer. (b) Relative x-y residence of 24 worms over 80 min (a value of 1 represents a uniform distribution). (c) Timecourse of worm residence along the y-axis over time, with odor added at 3 min (arrowhead). (d) Histograms of residence relative to different spatial odor patterns (red plots above and shading below). (e) Heatmaps of wild-type, mutant, and rescued animal residence in odor or buffer stripes over time, as in c. (f) Spatially-averaged behavioral parameters within 1.8 mm surrounding each odor edge (arrowhead), as described in Supplementary Fig. 9. Shading indicates odor. Directional parameters are shown for animals traveling downward before the event, with the upper (green) and lower (black) plots representing inward and outward movement relative to odor, respectively. Dot indicates worm head, and event locations correspond to the animal centroid at event initiation (circle). Data are mean ± s.e.m., n = 2–10 experiments for turn rates, n = 8–24 odor edges for other parameters, averaged over 37–230 animals per condition. (g) Spatial plot and histogram of upward (blue) and downward (red) “surf” curves occurring within 0.5 mm of the odor edge (dotted lines), by 25 worms over 1 hr. (h) Top, mean chemotaxis (CTX) index from 20–80 min, defined as (animal density in odor – density out of odor)/(total density); below, peak outward forward speed relative to speed in odor. Error bars as in f, with significance assessed by ANOVA and Bonferroni’s correction for multiple comparisons. **, P < 0.001; * P < 0.01; ns, not significant compared with wild-type no-odor control.

