Figure 5.
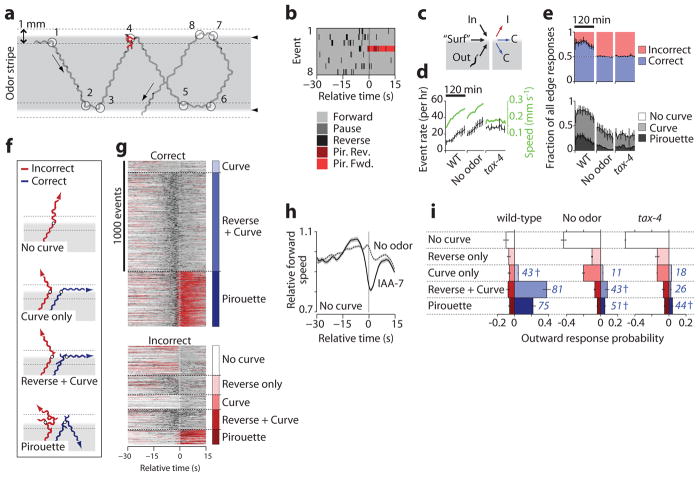
Turning responses at sharp spatial odor gradients. (a) A wild-type worm track within a 0.92 μM IAA odor stripe (gray) shows turning events (circled) initiated within 0.5 mm of the odor edge (dotted lines) or odor edge crossings. (b) Ethogram shows –30 s to +15 s relative to the eight numbered edge encounter events in a. (c) Events were grouped according to the direction of edge approach (inward, “surfing” (horizontal), or outward) and by the response outcome (correctly remaining in the odor (C), or incorrectly leaving the odor (I)). All eight events in a,b are correct. (d) Outward edge event rates (black) for wild-type experiments with odor (WT) or buffer stripes (No odor) and tax-4 with odor over 120 min, and average forward speed (green). (e) Correctness (above) and type (below) of all edge-triggered responses over 120 min. (f) Representative wild-type worm paths shown for correct and incorrect outward responses. Shading indicates odor. (g) Behavior rasters for wild-type worms heading outward, grouped by correctness and response category, n = 2,208 responses from 159 worms over 80 min. (h) Relative forward speed for WT animals that did not pirouette, curve or reverse upon exit of odor or buffer stripes. (i) Probabilities of outward responses for worms exiting odor and buffer stripes, indicating the percent correct for each category in blue. Data are mean ± s.e.m., n = 2–10 experiments. † indicates no significant difference from random (50% correct), P > 0.2 via two-tailed t-test.

