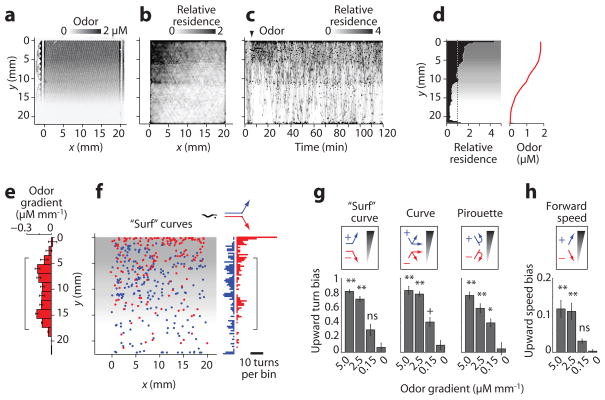
Figure 6.
Odor gradient assay. (a) Odor concentration gradient from 0–1.84 μM IAA in the arena, visualized with dye. (b) Relative x-y residence of 25 worms tracked over 120 min in the gradient; (a value of 1 represents a uniform distribution). (c) Timecourse of worm residence in the odor gradient, established at 5 min (arrowhead). (d) Distribution of wild-type worms over 120 min (average of 5 experiments) subjected to a spatial odor gradient (red plot and gray shading). (e) Odor concentration gradient calculated from odor profile in d (mean ± s.d., n = 6 points per 1.67 mm wide y-bin). (f) Location in the arena of “surf” curves directed up (blue) or down (red) the odor gradient. Bracket marks the region of constant odor gradient analyzed for turning bias. (g) Relative prevalence of “surf” curves, other curves, and pirouettes directed up (+1, blue) or down (–1, red) odor gradients from 0–5 μM mm−1 IAA. Indices on the y axis are defined as (# events up–# events down)/(total events per y-bin) averaged over the gradient region (bracketed in e, f). Bars indicate mean ± s.e.m., n = 5–9 y-bins averaged over 2–10 experiments. **, p<0.001; *, p<0.01; ns, not significant compared with wild-type no-odor control. Data for sharp gradients (≥2.5 μM mm−1) were obtained with stripe device (Fig. 4). (h) Upward bias of forward speed, defined as (speed up gradient–speed down gradient)/(mean speed per y-bin); statistics as in g.

