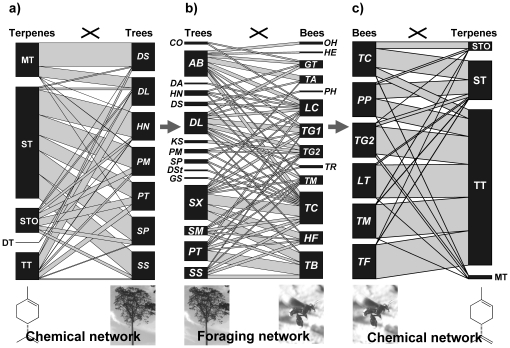
Figure 1. Chemical and foraging networks, representing (a) seven tree species and the terpenes of their resins (MT = monoterpenes, ST = sesquiterpenes without functional groups, STO = sesquiterpenes with functional groups, DT = diterpenes, TT = triterpenes), (b) 15 tree species and 13 bee species collecting resin at these trees, and (c) terpenes found on the body surface of six bee species.
Note that resin samples could not be analyzed for all tree species visited by bees and that nests were only found for six bee species, limiting the number of bee species whose chemical profiles were analyzed. Names of bee and tree species are given in Table 1. Block sizes represent overall proportions of species or terpene groups (based on mean relative amount of compounds) within a given network. Note that the chemical compounds of each tree and bee species add up to 100%, hence their block sizes are equal.

