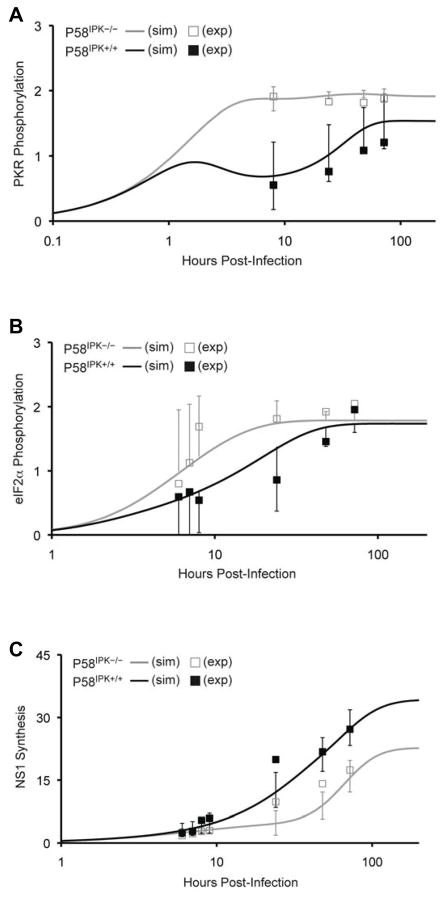
Figure 4. Prediction intervals for simulated PKR and eFI2α phosphorylation and NS1 synthesis show overlap with biological data.
200 h simulation (sim) results are shown for PKR phosphorylation (A), eIF2α phosphorylation (B), and influenza virus NS1 synthesis (C), in the presence (black line) or absence of P58IPK (grey line), using the parameter set generated from fitting simulated data with all biological data. At the timepoints where experimental data exists, prediction intervals for the simulated data are shown. Experimental (exp) data are represented with black or grey boxes. Only single direction prediction intervals are shown in panel B.

