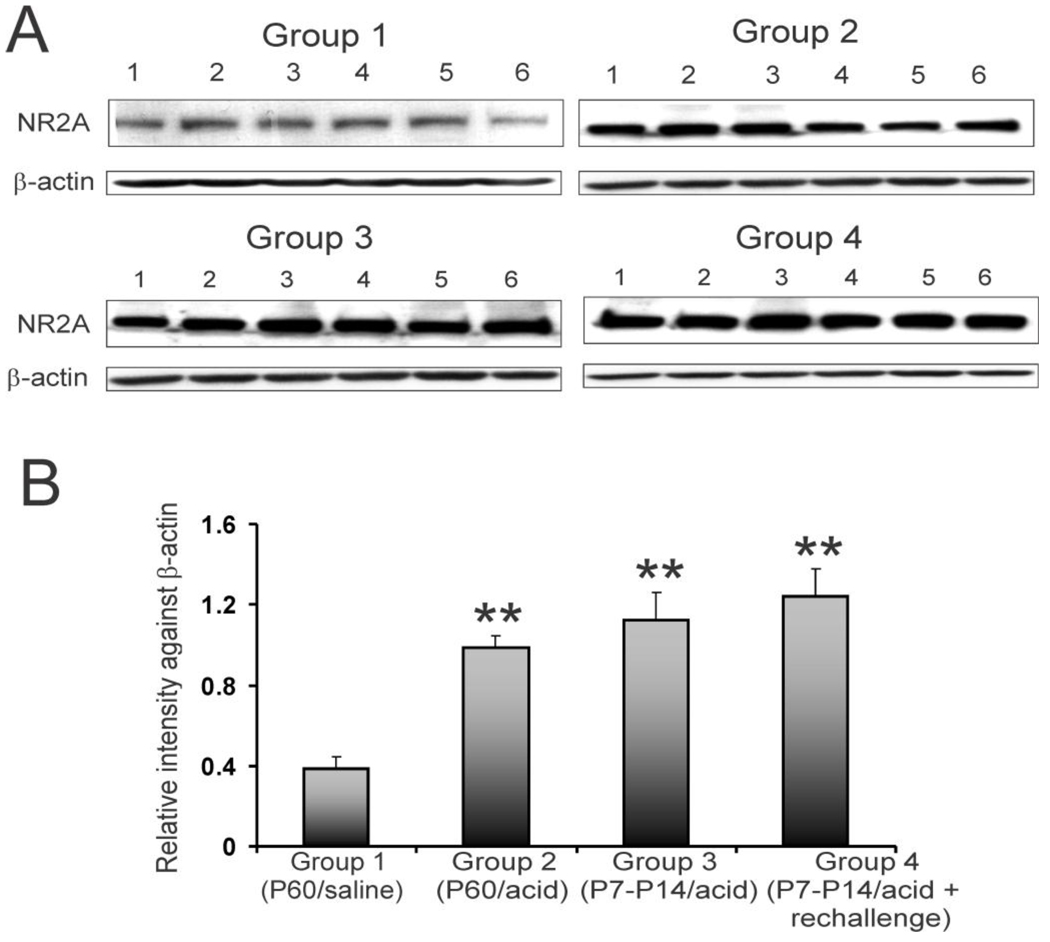
Figure 3.
NR2A expression in rCCs at P60 following esophageal acid exposure at different time points of development. The treatment strategies were the same as indicated in fig. 1A. A: blots show NR2A and β-actin expression in individual animals (n=6/group) for 4 different groups. B: bar graphs represent relative intensity of staining against β-actin. Asterisks indicate significant difference compared to group 1 (**p<0.001).

