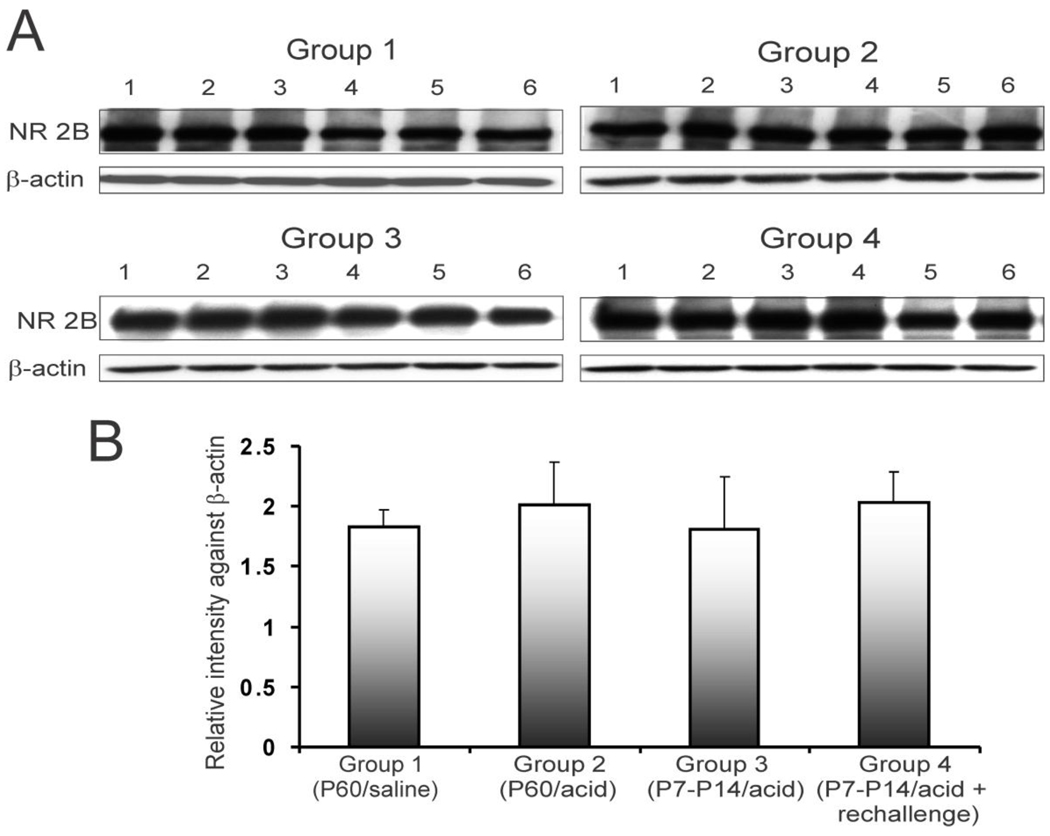
Figure 4.
NR2B expression pattern in rCCs at P60 following esophageal acid exposure at different time points of development. The treatment strategies were the same as indicated in fig. 1C. A. blots show NR2B and β-actin expression in individual animals (n=6/group) for 4 different groups. B. bar graphs represent relative intensity of staining against β-actin.

