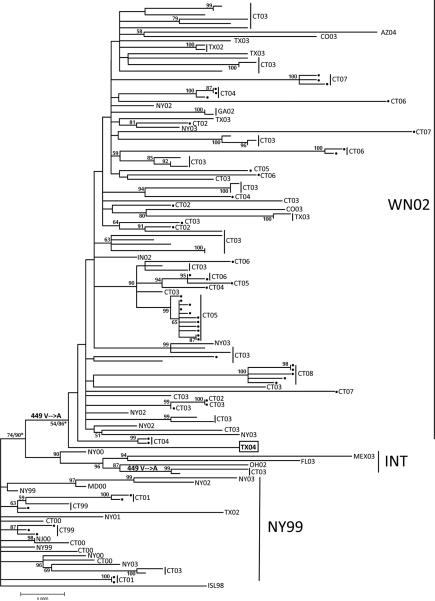
Figure 2.
Phylogenetic tree depicting relationships of 135 WNV isolates based on maximum likelihood analysis of 10,393 nucleotides sites. Viruses are labeled by the state or country of origin followed by the year of isolation. Numbers at nodes indicate bootstrap values >50%. Branch lengths are proportional to the number of nucleotide substitutions. Stratford taxa are highlighted with a black dot. Asterisk indicates bootstrap values with and without recombinant taxon TX04.

