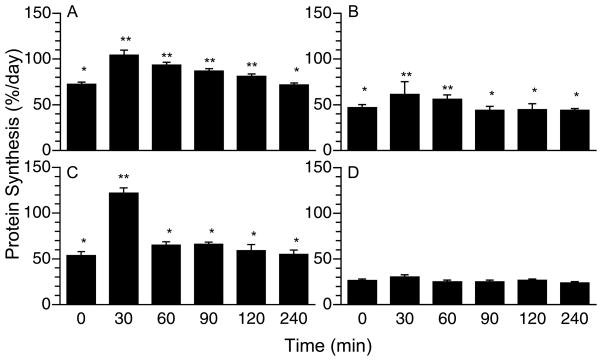
Figure 2.
Time course of the changes in PS rates in liver (A), jejunum (B), pancreas (C), and kidney (D) of neonatal after a meal. Values are means ± SEM, n = 4–6. ANOVA showed a treatment effect on PS in liver (P < 0.001), jejunum (P < 0.05), and pancreas (P < 0.05). Means without a common symbol differ, P < 0.05.

