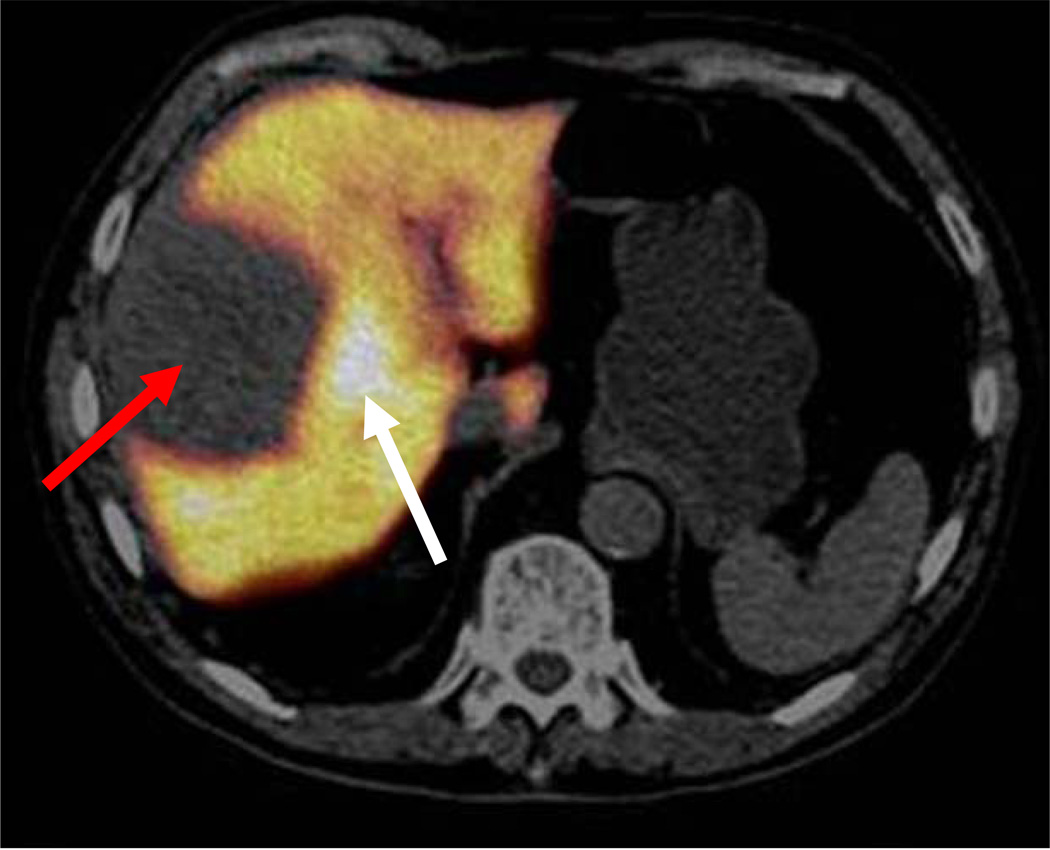
Fig. 2.
FDGal PET/CT image (a) and ceCT image in arterial phase (b) of a large necrotic HCC (white arrows) with adjacent viable tumour tissue (red arrows) (ID22, transaxial view). The patient did not have cirrhosis and the aetiology was unknown. Plasma AFP was 3047 ng/ml and the multi-phase ceCT typical for HCC [5, 6].

