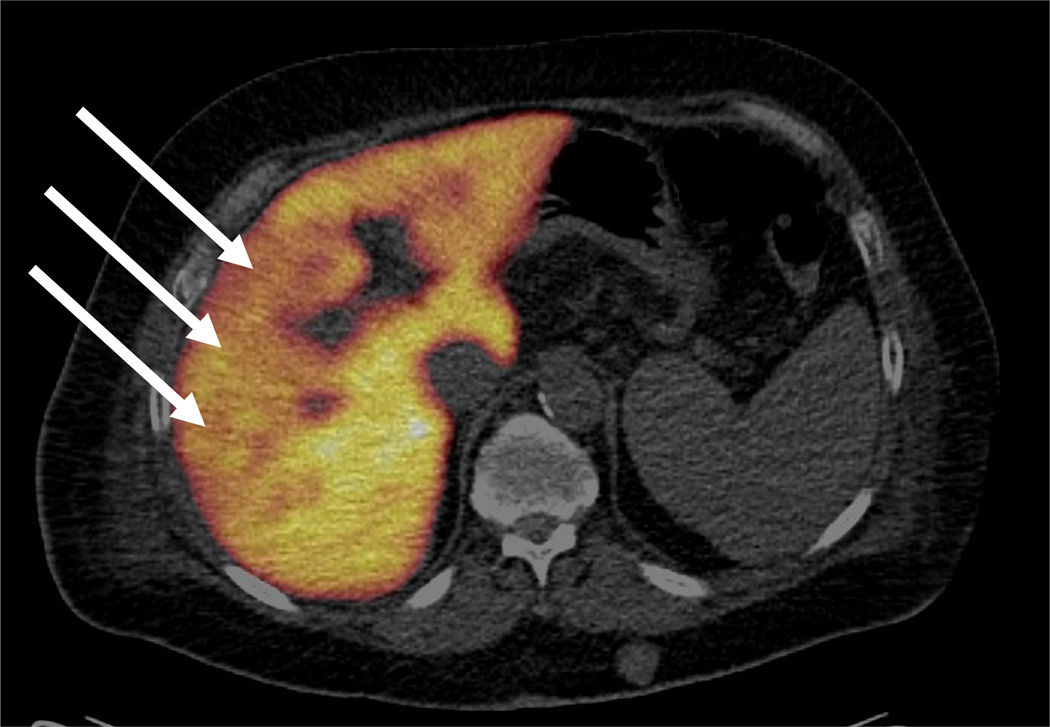
Fig. 3.
Example of a large HCC with low metabolic activity seen as an area with low FDGal uptake on the FDGal PET/CT image (a), atypical low contrast-enhancement in the arterial phase of multi-phase ceCT, and typical washout pattern in the late venous phase on ceCT(c) (ID12, transaxial view). A biopsy showed HCC (medium differentiated). The aetiology was alcoholic cirrhosis and plasma AFP was 11 ng/ml.

