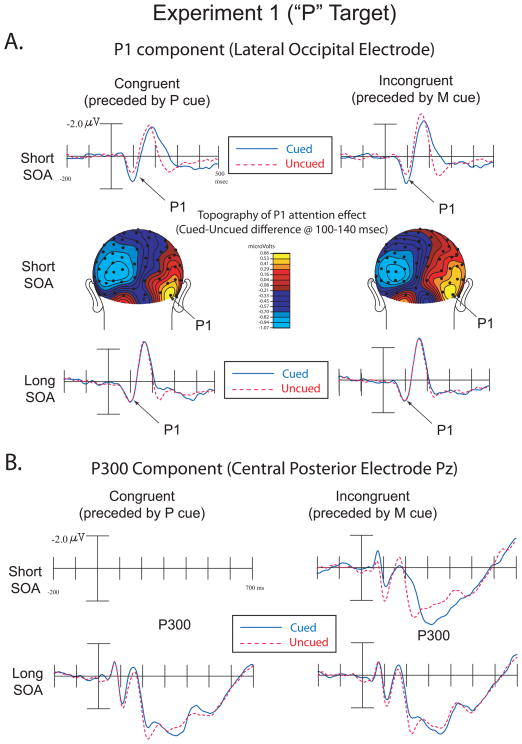
Figure 2.
Experiment 1 (“P” Targets). A. ERPs showing the P1 component over lateral occipital electrodes in congruent and incongruent trials over short and long SOAs (top and bottom illustrations). These data are collapsed over contralateral scalp sites (i.e. left hemisphere data for right visual field targets were combined with right hemisphere data for left visual field targets). Topographic voltage maps from cued-uncued difference waves at the short SOA represent the distribution of neural activity highlighting the P1 attention effect (middle illustration). The right side of the topographic voltage maps represents neural activity contralateral to visual stimulation while the left side represents ipsilateral activity.
B. ERPs showing the P300 component in congruent and incongruent trials over short and long SOAs.

