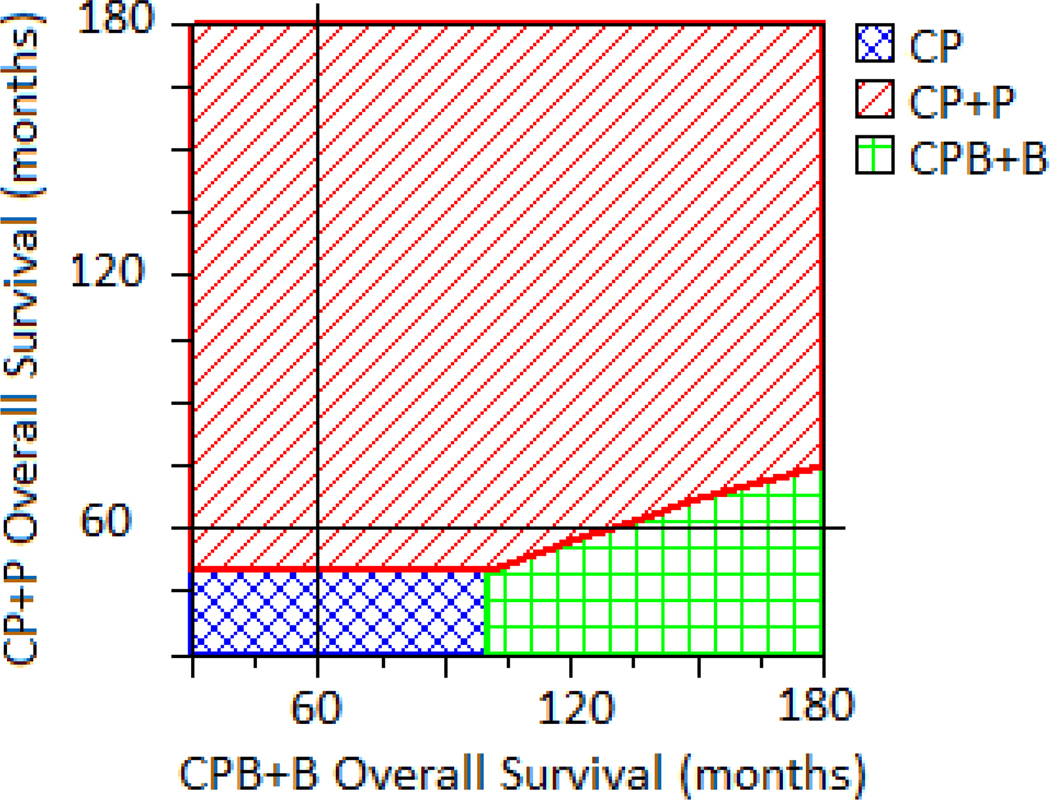
Figure 2.
Two-way sensitivity analysis varying OS for CP+P and CPB+B. Each solid black line is the base case model OS assumption (60 months for each arm). The intersection of these lines falls in a demarcated region where a given treatment strategy is the preferred one given a willingness to pay threshold of $100,000/QALY. In the current model, the intersection falls in the CP+P region, suggesting it is the preferred strategy, but if OS for CPB+B were 160 months and OS for CP+P remained the same, the intersection would move to the CPB+B region, suggesting it is the cost-effective strategy.

