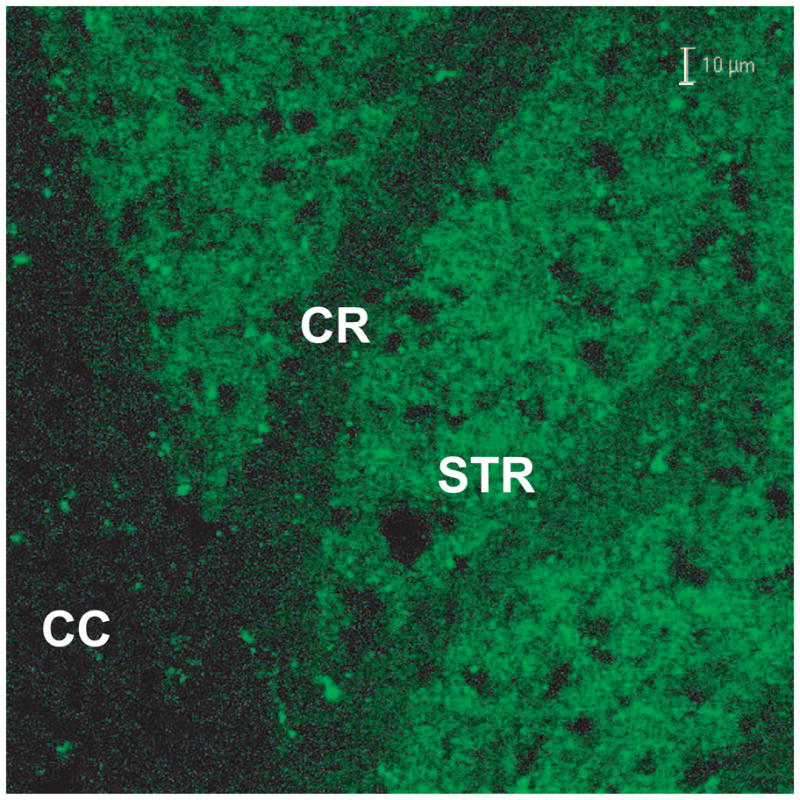
Figure 1.

Expression pattern of EGFP in a transgenic mouse generated with the Egfp gene under the control of the Nse promoter. EGFP fluorescence in corpus callosum (CC) and striatum (Str) of a hemizygous Tg mouse is shown. Note the lack of, or low levels of, EGFP fluorescence in myelinated tracks, such as those in the CC and in part of corona radiata (CR). Line: 10 μm
