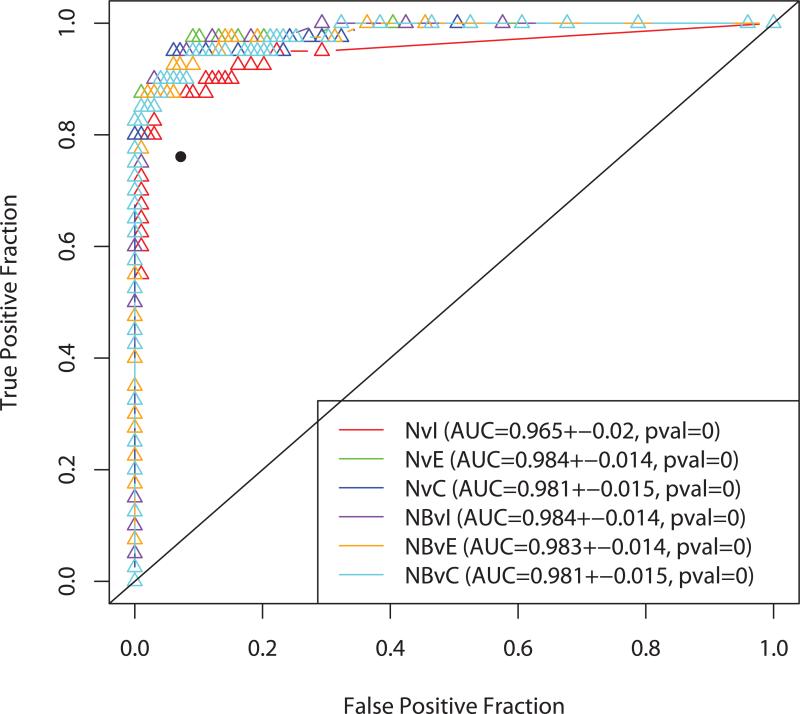
Figure 2.
Plots of the ROC curves for models trained on six subsets of the MD Anderson data. These six models did use CA125. The isolated black point is the performance of CA125 Alone. The p value was computed by applying the Wilcoxon-Mann-Whitney test to the AUC value (bootstrap empirical p-value = 0.038).

