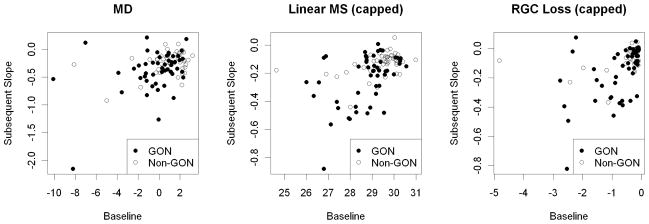
Figure 1.
The subsequent rate of change over years 2–7 of the sequence, plotted against baseline value in Year 1, for three of the global indices considered in this study; Mean Deviation (MD), Capped Linear Mean Sensitivity (LMS(cap)), and Capped RGC Loss according to the model by Hood et al (LossHo(cap)). Note that while the units for all indices are decibels, the scales on the axes differ, since the indices took values over different ranges. Shading of the data points indicates whether the participant exhibited glaucomatous optic neuropathy at their initial visit.

