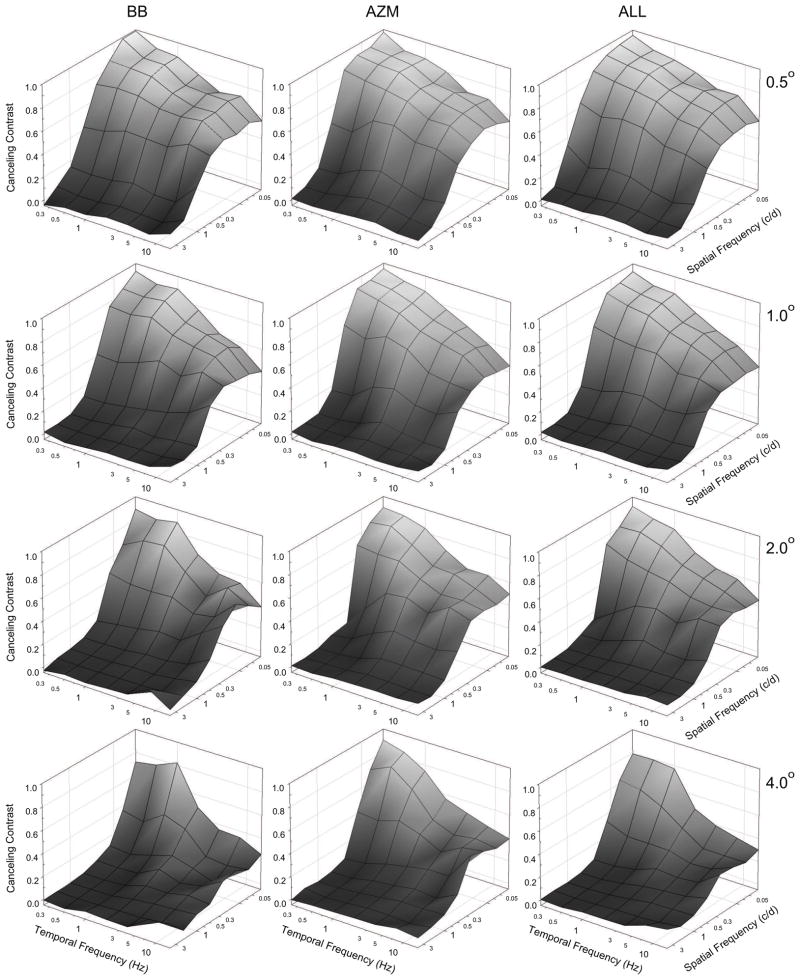
Figure 3.
The mesh plots in the first two columns plot separately for two observers (BB and AZM), mean canceling contrast as a function of inducing grating spatial and temporal frequency. The third column depicts the average mean canceling contrast for all four observers (ALL). The rows plot data for the four test field heights 0.5°, 1.0°, 2.0° and 4.0°, respectively. At all test field heights canceling contrast is a low-pass function of spatial and temporal frequency. Induction is greatest at low frequencies and declines with increasing frequency in both dimensions.

