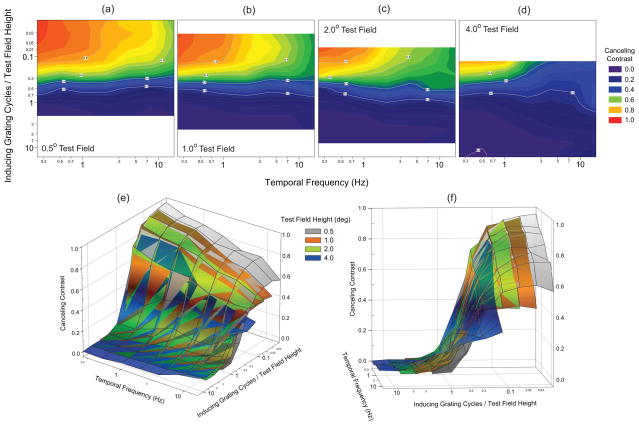
Figure 4.
Mean induction magnitude data for the 4 observers (ALL) from Fig. 3 replotted as contour (a–d) and mesh plots (e, f) after replacing the inducing spatial frequency axis with one that indexes the product of inducing spatial frequency (c/d) and test field height (d), whose unit is the number of grating cycles (c) that would fit within the specified test field height. Color indexes canceling contrast in the contour plots where the four test field heights are plotted separately; but, distinguishes the four different test field heights in the mesh plots. Plotting the induction magnitude data at the four test field heights in this manner illustrates that they can be described as four partially overlapping sections of a single extended spatiotemporal induction surface.

