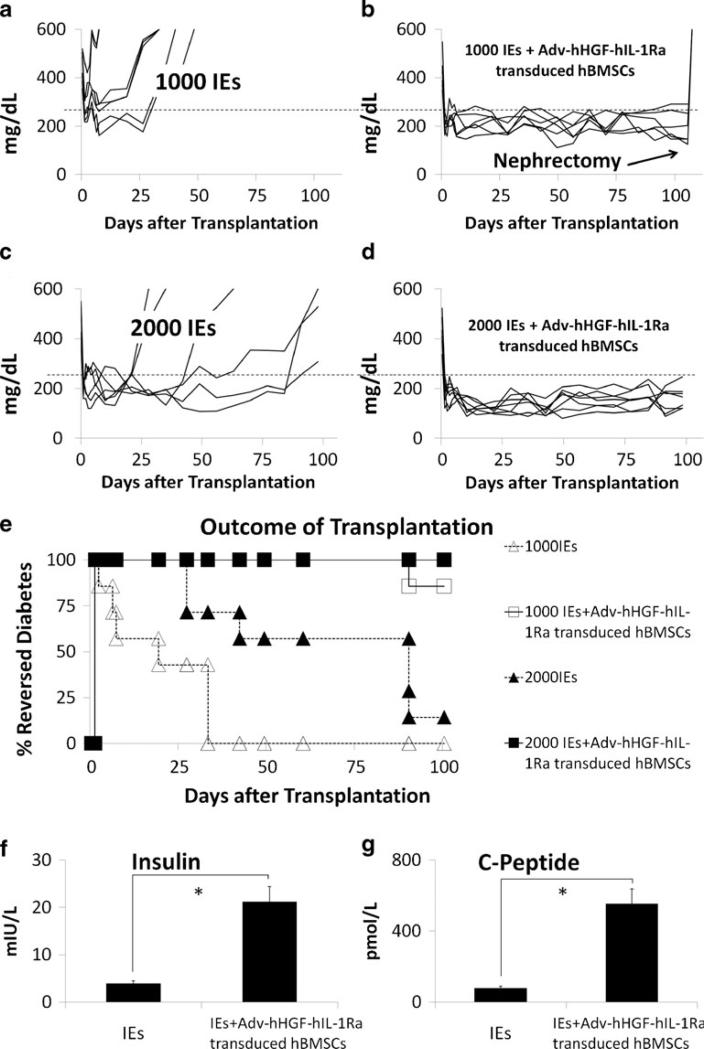
Fig. 4.
Outcome of islet transplantation after being cotransplanted with Adv-hHGF-hIL-1Ra-transduced hBMSCs. (a–d) The blood glucose level of every single mouse after receiving 1000 IEs (a), 1000 IEs co-transplanted with Adv-hHGF-hIL-1Ra-transduced hBMSCs (b), 2000 IEs (c) and 2000 IEs co-transplanted with Adv-hHGF-hIL-1Ra-transduced hBMSCs (d). Blood glucose≤250 mg/dL was identified as reversed-diabetes (dashed line)(e). Reversed-diabetes ratio of the NOD-SCID mice after islet transplantation. White triangles = mice receiving 1000 IEs, white squares = mice receiving 1000 IEs co-transplanted with Adv-hHGF-hIL-1Ra-transduced hBMSCs, black triangles = mice receiving 2000 IEs, black squares = mice receiving 2000 IEs co-transplanted with AdvhHGF-hIL-1Ra-transduced hBMSCs. (f) Average serum insulin level of the mice receiving 1000 IEs and 1000 IEs co-transplanted with Adv-hHGF-hIL-1Ra-transduced hBMSCs 15 weeks after islet transplantation, as determined by ELISA. (g) Average serum c-peptide level of the mice receiving 1000 IEs and 1000 IEs co-transplanted with Adv-hHGF-hIL-1Ra-transduced hBMSCs 15 weeks after islet transplantation, as determined by ELISA. Data are presented as the mean ± SD, n=7. *P<0.05 under t test.

