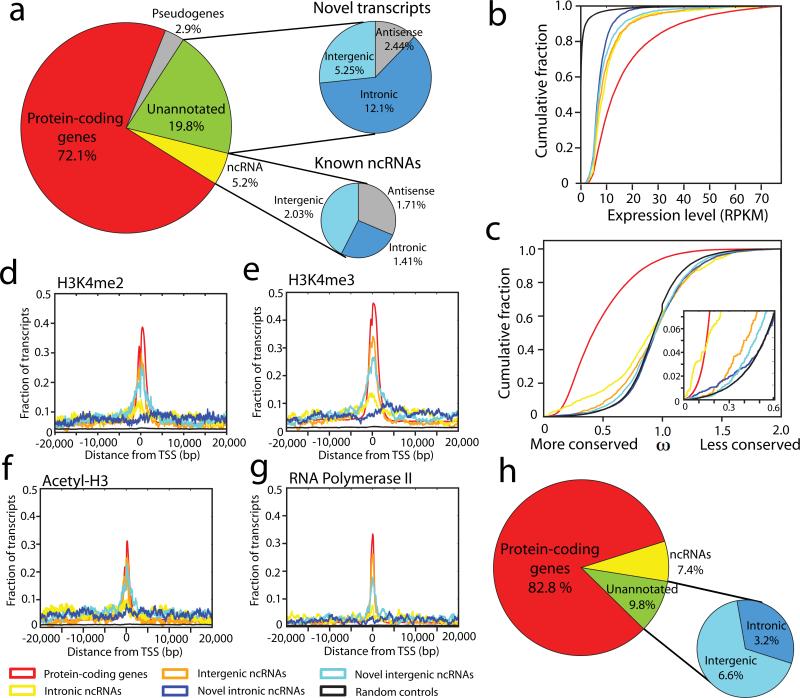
Figure 2. Prostate cancer transcriptome sequencing reveals dysregulation of novel transcripts.
(a) A global overview of transcription in prostate cancer. The left pie chart displays transcript distribution in prostate cancer. The upper and lower right pie charts display unannotated or annotated ncRNAs, respectively categorized as sense transcripts (intergenic and intronic) and antisense transcripts. (b) A line graph showing that unannotated transcripts are more highly expressed (RPKM) than control regions. Negative control intervals were generated by randomly permuting the genomic positions of the transcripts. (c) Conservation analysis comparing unannotated transcripts to known genes and intronic controls shows a subtle degree of purifying selection among unannotated transcripts. The insert on the right shows an enlarged view. (d-g) Intersection plots displaying the fraction of unannotated transcripts enriched for H3K4me2 (d), H3K4me3 (e), Acetyl-H3 (f) or RNA polymerase II (g) at their transcriptional start site (TSS) using ChIP-Seq and RNA-Seq data for the VCaP prostate cancer cell line. The legend for these plots (b-g) is shared and located below (f) and (g). (h) A pie chart displaying the distribution of differentially expressed transcripts in prostate cancer (FDR < 0.01).

