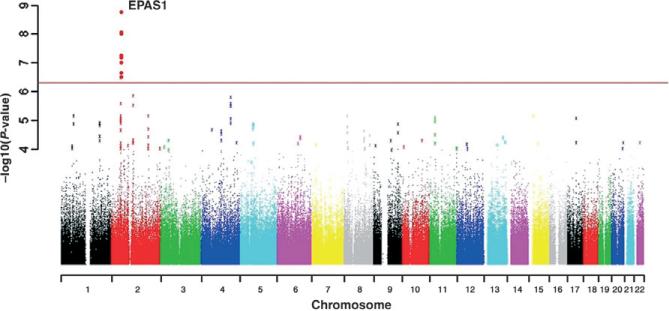
Figure 6.
A genome-wide allelic differentiation scan that compares Tibetan residents at 3 200–3 500 m in Yunnan Province, China with HapMap Han samples. Eight SNPs near one another and EPAS1 have genome-wide significance. The horizontal axis is the genomic position, with colours indicating chromosomes. The vertical axis is the negative log of SNP-by-SNP P-values generated from the Yunnan Tibetan vs. HapMap Han comparison. The red line indicates the threshold for genome-wide significance used. From Beall et al. (2010).

