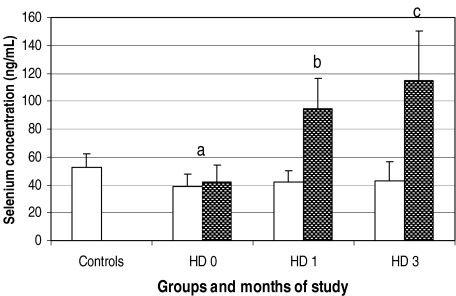
Fig. 1.
Selenium concentration in plasma of healthy subjects and chronic kidney disease patients on hemodialysis supplied with placebo (white columns) and selenium (dark columns; the values of both subgroups were taken together) at the beginning of the study (HD 0) and after 1 (HD 1) and 3 months (HD 3). Statistics: a, HD 0 (both subgroups) vs. controls, P < 0.0001; b, HD 1 + Se vs, HD 0 + Se, P < 0.0001; c, HD 3 + Se vs. HD 1 + Se, P < 0.01

