
Fig. 4.
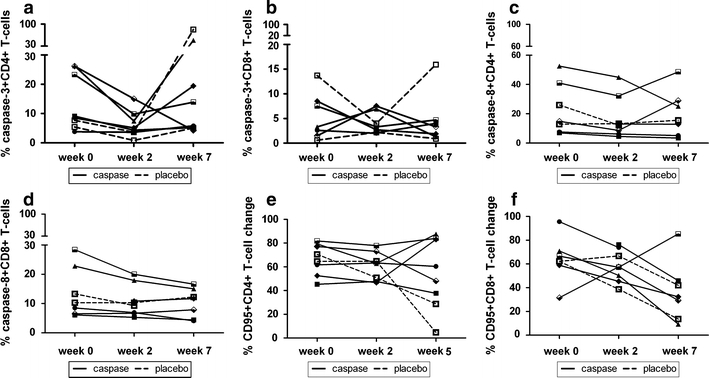
Longitudinal analysis of activated caspase-3, caspase-8 and CD95 expression Longitudinal analysis of CD4+ and CD8+ T-cells expressing activated caspase-3 (a, b), caspase-8 (c, d) and CD95 (e, f) during therapy. On the y-axis percentages of either activated caspase-3, caspase-8 or CD95 are shown and on the x-axis the weeks of the study are depicted. The black solid lines represent the patients receiving GS-9450 and the black dotted lines represent those taking placebo. One patient’s CD8+ T-cells at baseline (see Fig. 3) and another patient’s CD8+ T-cells at week 7 were not available for analysis